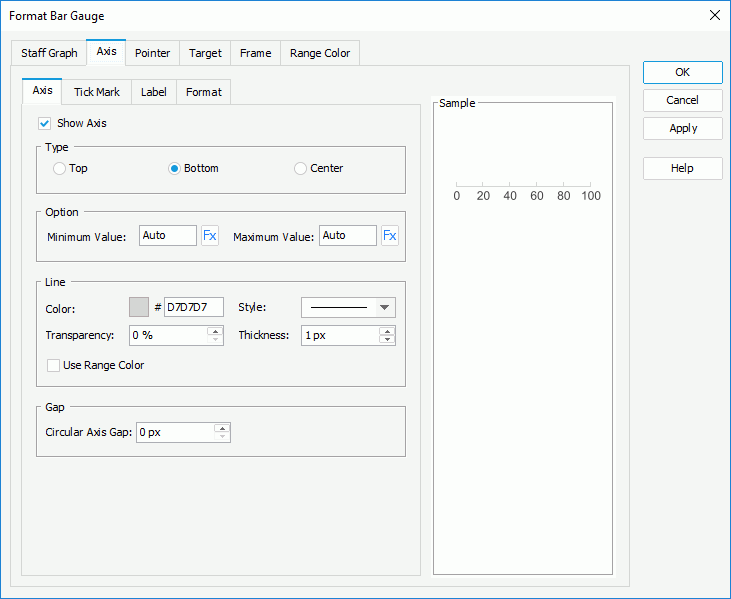
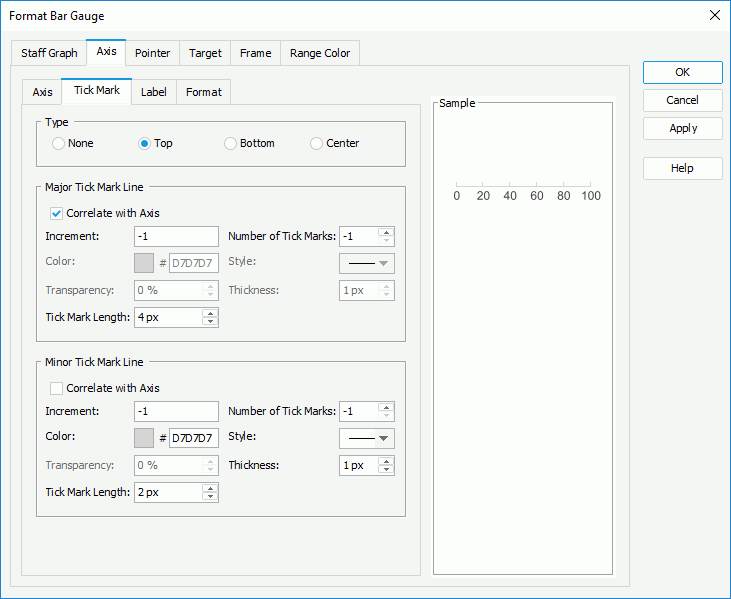
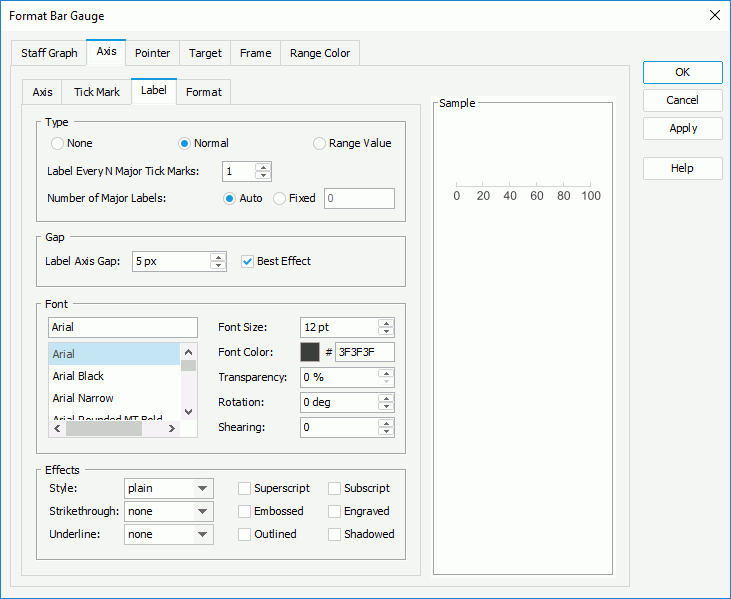
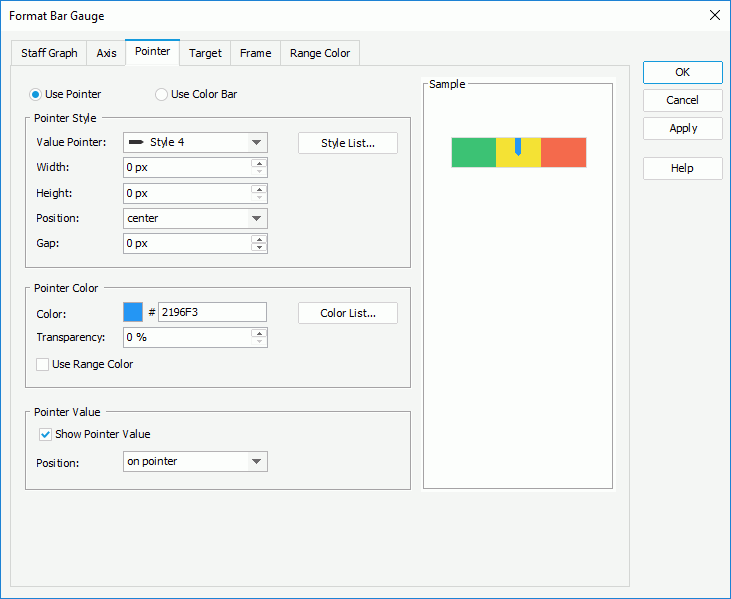
This dialog appears when you double-click a bar gauge of a chart in a report, or right-click it and select Format Bar Gauge from the shortcut menu. It helps you to format a bar gauge.
Does not retain any changes and closes the dialog.
Apply
Applies all changes and leaves the dialog open.
Help
Displays the help document about this feature.
Staff Graph
Specifies the properties for bars in the bar gauge.
Bar
Specifies the properties of the bars.
Layout
Specifies the layout of the bars. It can be vertical or horizontal.
Thickness
Specifies the thickness of the bars, in pixels.
Start Style
Specifies the style for the start graph of the bars.
End Style
Specifies the style for the end graph of the bars.
Range Border
Specifies properties of the bar border.
Color
Specifies the color of the border. To edit the color, click the color indicator and select a color from the color palette or input the hexadecimal value (for example, 0xff0000) of a color directly in the text box.
Line Style
Specifies the line style of the border.
Transparency
Specifies the transparency for the border color.
Thickness
Specifies the thickness of the border, in pixels.
Show Range Name
Specifies whether to show the names of the ranges defined in the Range Color tab.
Transparency
Specifies the color transparency of the line.
Style
Specifies the style of the line.
Thickness
Specifies the thickness of the line.
Use Range Color
Specifies whether the axis line color follows the colors of the ranges, that is, the axis line part for the range of blue color will become blue and the part for the range of red color will become red. If checked, the Color and Transparency options will be disabled.
Gap
Specifies the gap between the axis and the bar when the axis is not in the center of the bar. The option is disabled when Type is set to center in the tab.
Tick Mark
Specifies the properties of the tick marks on the axis.
Type
Specifies the position relationship of the axis and the tick marks. When Layout is set to horizontal in the Staff Graph tab, the following are available:
None
Specifies not to display the tick marks on the axis. It's meaningless to specify all the other tick mark related properties if this type is selected.
Top
Specifies to display the tick marks on the top of the axis.
Bottom
Specifies to display the tick marks on the bottom of the axis.
Center
Specifies to display the tick marks in the center of the axis.
When Layout is set to vertical in the Staff Graph tab, the following are available:
None
Specifies not to display the tick marks on the axis. It's meaningless to specify all the other tick mark related properties if this type is selected.
Left
Specifies to display the tick marks on the left of the axis.
Right
Specifies to display the tick marks on the right of the axis.
Center
Specifies to display the tick marks in the center of the axis.
Major Tick Mark Line
Specifies the properties of the major tick mark line.
Correlate with Axis
If checked, the line properties of the major tick marks will correlate with that of the axis automatically.
Color
Specifies the color of the major tick mark line. Disabled when Use Range Color in the Axis sub tab is checked.
Style
Specifies the style of the major tick mark line.
Transparency
Specifies the color transparency of the major tick mark line. Disabled when Use Range Color in the Axis sub tab is checked.
Thickness
Specifies the thickness of the major tick mark line.
Increment
Specifies the distance between two adjacent major tick marks on the axis.
Number of Tick Marks
Specifies how many major tick marks to be displayed on the axis.
Tick Mark Length
Specifies the length of the major tick mark line.
Minor Tick Mark Line
Specifies the properties of the minor tick mark line.
Correlate with Axis
If checked, the line properties of the minor tick marks will correlate with that of the axis automatically.
Color
Specifies the color of the minor tick mark line. Disabled when Use Range Color in the Axis sub tab is checked.
Style
Specifies the style of the minor tick mark line.
Transparency
Specifies the color transparency of the minor tick mark line. Disabled when Use Range Color in the Axis sub tab is checked.
Thickness
Specifies the thickness of the minor tick mark line.
Increment
Specifies the distance between two adjacent minor tick marks on the axis.
Number of Tick Marks
Specifies how many minor tick marks to be displayed on the axis.
Tick Mark Length
Specifies the length of the minor tick mark line.
Label
Specifies the properties of the major tick mark labels.
Type
Specifies the type of the labels.
None
If selected, the labels will not be shown.
Normal
If selected, the labels will be shown as you specify.
Label Every N Major Tick Marks
Specifies the frequency at which the major tick marks will be labeled.
Number of Major Labels
Specifies how many major tick mark labels to be displayed on the axis.
Auto
If checked, all major tick mark labels will be shown.
Fixed
If checked, you can specify the number of the major tick mark labels to be displayed on the axis.
Range Value
If selected, the labels will show the range values.
Gap
Specifies the gap properties for the major tick mark labels.
Label Axis Gap
Specifies the distance between the labels and the axis, in pixels.
Best Effect
Specifies whether to adjust the labels automatically to make them placed best. If checked, some labels will be hidden when they are overlapped.
Font
Specifies the font format of text in the major tick mark labels.
Font list
Lists all the available font faces that can be selected to apply to the text.
Font Size
Specifies the font size of the text.
Font Color
Specifies the font color of the text. Disabled when Use Range Color in the Axis sub tab is checked.
Transparency
Specifies the color transparency of the text. Disabled when Use Range Color in the Axis sub tab is checked.
Rotation
Specifies the rotation angle of the text around its center, in degrees. The default value is 0.
Shearing
Specifies the gradient of the text.
Effects
Specifies the special effects of text in the tick mark labels.
Style
Specifies the font style of the text. It can be one of the following: plain, bold, italic, and bold italic.
Strikethrough
Specifies the style of the horizontal line with which the text is struck through. It can be one of the following: none, thin line, bold line, and double lines.
Underline
Specifies the style of the horizontal line under the text. It can be one of the following: none, single, single lower, bold line, bold lower, double lines, bold double, patterned line, and bold patterned.
Superscript
Raises the text above the baseline and changes the text to a smaller font size, if a smaller size is available.
Embossed
Makes the text appear to be raised off the page in relief.
Outlined
Displays the inner and outer borders of each character.
Subscript
Lowers the text below the baseline and changes the text to a smaller font size, if a smaller size is available.
Engraved
Makes the text appear to be imprinted or pressed into the page.
Shadowed
Adds a shadow beneath and to the right of the text.
Format
Specifies the data format of the major tick mark labels.
Category
Lists the category types. Select one to customize its format.
Format
Displays all the formats of the selected category. Select the required one and click Add to add it as the format of the specified category. You can add only one format for each category.
Properties
Displays the properties of the format you select. If the formats listed in the Format box cannot meet your requirement, define the format in the text field and then click Add to add it as the format of the specified category.
Auto Scale in Number
The property takes effect for the Number category. It specifies whether to
automatically scale the values that fall into the two ranges:
When 1000 <= Value < 10^15, SI (International System of Units) Symbol is used to scale numbers and the following quantity unit symbols are used: K (10^3), M (10^6), G (10^9), and T (10^12).
When 0 < Value < 0.001 or Value >= 10^15, scientific notation is used to scale numbers.
The value "auto" means that the property setting follows that of the parent data container.
When the property is true: for the values that are to be scaled, the Format setting applies to the integer part of the values after scaled; if the specified format conflicts with the Auto Scale in Number property, for example, the values are displayed in percentage, then the Auto Scale in Number property is ignored.
Stack
Lists all the formats you select from different categories.
Add
Adds a format to the Stack list box.
Remove
Removes a format from the Stack list box.
Apply
Applies the specified format in the Stack list box to the major tick mark labels.
Pointer
Specifies the properties of the pointers in the bar gauge.
Use Pointer
Specifies to use pointers to indicate values in the bar gauge.
Pointer Style
Specifies properties of the pointers.
Value Pointer
Specifies the style of the pointers. Select a style from the drop-down list or select Customized and specify another image as the pointer.
Width
Specifies the width of the pointers.
Height
Specifies the height of the pointers.
Position
Specifies the position of the pointers relative to the bar.
Gap
Specifies the distance between the pointers and the bar, in pixels.
Style List
Opens the Style List dialog to specify the style for pointers in the same data series respectively.
Pointer Color
Specifies color properties of the pointers.
Color
Specifies the color of the pointers.
Color List
Opens the Color List dialog to specify the color pattern for pointers in the same data series respectively.
Transparency
Specifies the transparency for color of the pointers.
Use Range Color
Specifies whether to use the color defined for the ranges as the pointer color. If checked, the three properties above will be disabled.
Pointer Value
Specifies properties for values of the pointers.
Show Pointer Value
Specifies whether to show values for the pointers.
Position
Specifies the position relationship between the values and the pointers. Select the position from the drop-down list or select customized to customize the position by dragging any pointer value in the design area.
Use Color Bar
Specifies to use color bars to indicate values in the bar gauge.
Pointer Color
Specifies the properties of the color bars.
Color
Specifies the color of the bars.
Transparency
Specifies the transparency for color of the bars.
Thickness
Specifies the thickness of the color bars.
Color List
Opens the Color List dialog to specify the color pattern for color bars in the same data series respectively.
Pointer Value
Specifies properties for values of the color bars.
Show Pointer Value
Specifies whether to show values for the color bars.
Position
Specifies the position relationship between the values and the color bars. Select the position from the drop-down list or select customized to customize the position by dragging any value in the design area.
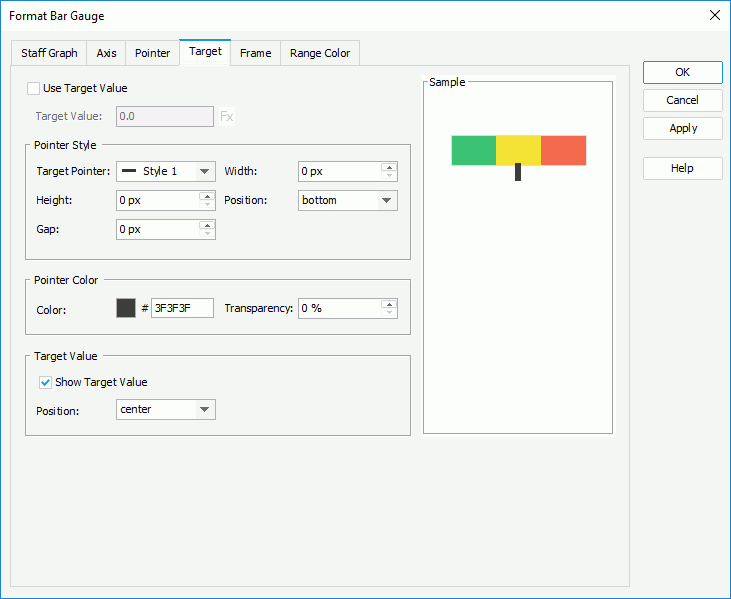
Target
Specifies the properties of the target in the bar gauge.
Use Target Value
Specifies whether to use target value for the bar gauge.
Target Pointer
Specifies the style of the target pointer. Select a style from the drop-down list or select Customized and specify another image as the target pointer.
Width
Specifies the width of the target pointer.
Height
Specifies the height of the target pointer.
Position
Specifies the position of the target pointer relative to the bar.
Gap
Specifies the distance between the target pointer and the bar.
Pointer Color
Specifies color properties of the target pointer.
Color
Specifies the color of the target pointer.
Transparency
Specifies the color transparency of the target pointer.
Target Value
Specifies the properties of the target value.
Show Target Value
Specifies whether to show the target value on the bar gauge.
Position
Specifies the position of the target value relative to the bar. Select the position from the drop-down list or select customized to customize the position by dragging the target value in the design area.
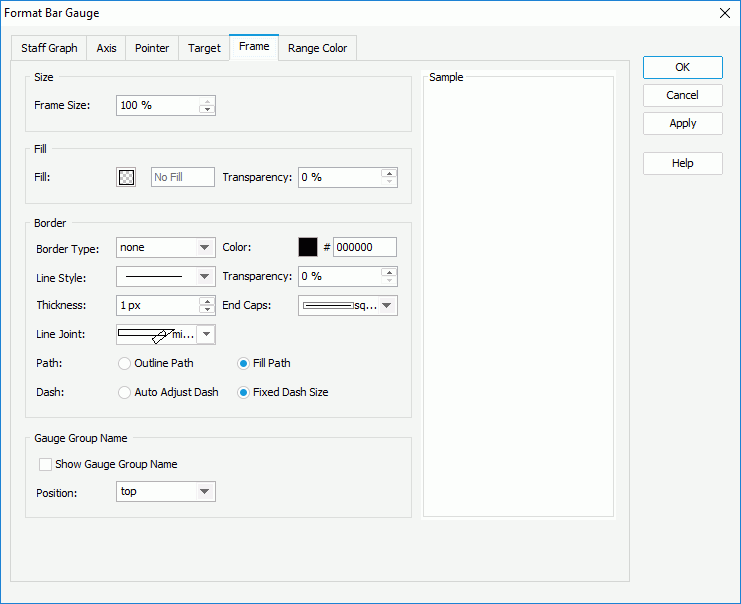
Frame
Specifies properties for the frame of the bar gauge chart.
Size
Specifies the size properties of the frame.
Frame Size
Specifies the size of the frame.
Fill
Specifies the color and transparency of the frame.
Fill
Specifies the color to fill the frame.
Transparency
Specifies the transparency to fill the frame.
Border
Specifies the properties for borders of the frame.
Border Type
Displays the type of the border.
Color
Specifies the color of the border. To edit the color, click the color indicator and select a color from the color palette or input the hexadecimal value (for example, 0xff0000) of a color directly in the text box.
Line Style
Specifies the line style to apply to the border.
Transparency
Specifies the transparency for color of the border.
Thickness
Specifies the thickness of the border, in pixels.
End Caps
Specifies the ending style of the border line.
butt
Ends unclosed sub paths and dash segments with no added decoration.
round
Ends unclosed sub paths and dash segments with a round decoration that has a radius equal to half of the width of the pen.
square
Ends unclosed sub paths and dash segments with a square projection that extends beyond the end of the segment to a distance equal to half of the line width.
Line Joint
Specifies the line joint style for the border line.
miter
Joins path segments by extending their outside edges until they meet.
round
Joins path segments by rounding off the corner at a radius of half the line width.
bevel
Joins path segments by connecting the outer corners of their wide outlines with a straight segment.
joint round
Joins path segments by rounding off the corner at the specified radius.
Path
Specifies the fill pattern of the border line.
Outline Path
Specifies the fill pattern of the border line to be outline path.
Fill Path
Specifies the fill pattern of the border line to be whole path.
Dash
Specifies the dash size of border line.
Auto Adjust Dash
If selected, the dash size will be adjusted automatically.
Fixed Dash Size
If selected, the dash size will be fixed size.
Gauge Group Name
Specifies properties for the gauge group name.
Show Gauge Group Name
Specifies whether to show names for the bars in the bar gauge which are values of the field on its category axis. If the bar gauge contains no category field, the group name shows Report by default.
Position
Specifies the position of the names relative to the bars.
Range Color
Specifies different colors to fill the bars in bar gauge in different ranges.
Use Gradient Effect
Specifies whether to use gradient effect for the color.
Adds a new color range.
Removes the selected color range.
Minimum
Specifies the minimum value of the range.
Maximum
Specifies the maximum value of the range.
Color
Specifies the color schema of the range. Click in the color cell to customize the color on the color palette.
Name
Displays the name of the range.
Others
Specifies the properties for values that do not fall into any of the ranges you defined.
Name
Specifies the name for the values.
Color
Specifies the color for the values. To edit the color, click the color indicator and select a color from the color palette or input the hexadecimal value (for example, 0xff0000) of a color directly in the text box.
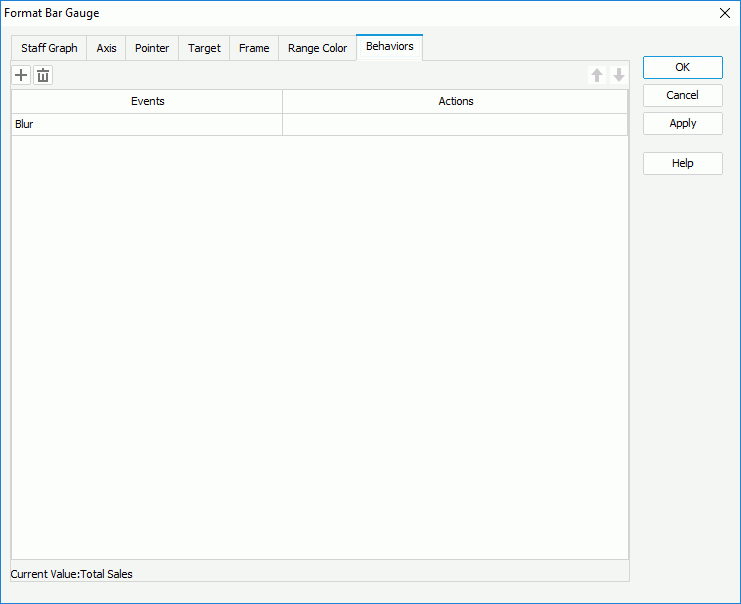
Behaviors
Specifies some web behaviors to the bar gauges.
Adds a new web behavior line.
Removes the selected web behavior.
Moves the selected web behavior up a step.
Moves the selected web behavior down a step.
Events
Specifies the trigger event.
Actions
Specifies the action you want the event to trigger.
Opens the Web Action List dialog to bind a web action to the event.
 Previous Page Next Page