 Previous Page Next Page
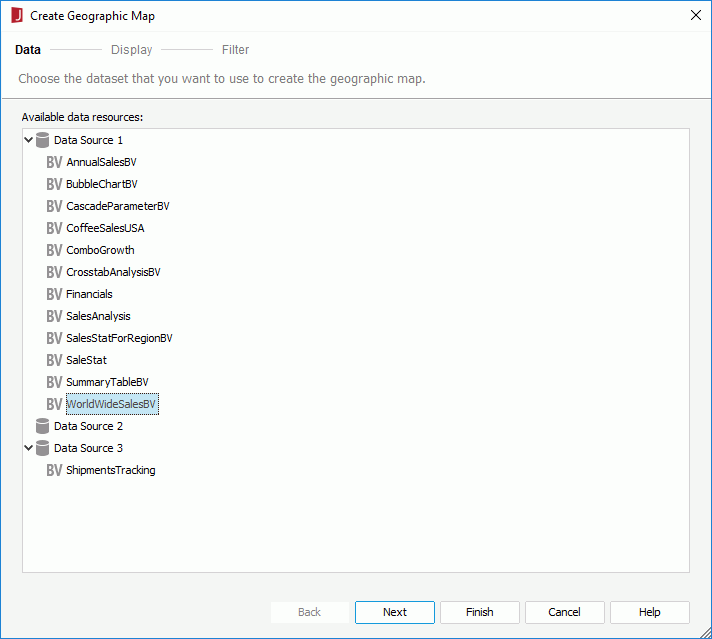
With the geographic map wizard, it is easy to create geographic maps in a report, however the wizard varies with the report type: web report/library component and page report.
If you want to use geographic maps in a page report, you need to make sure the page report is created using query resources. Geographic map is not supported in page reports that are based on business views.
A geographic map can be inserted into the report areas listed in Component placement. When it is inserted into a banded object, you can use a data container link to define the relationship between the geographic map and its parent.
 from the Visual category of the Components panel.
The Create Geographic Map Wizard appears, which contains a set of screens for helping you define a geographic map easily. You can use the Back and Next buttons or click the screen name on the screen navigation bar to switch between the screens.
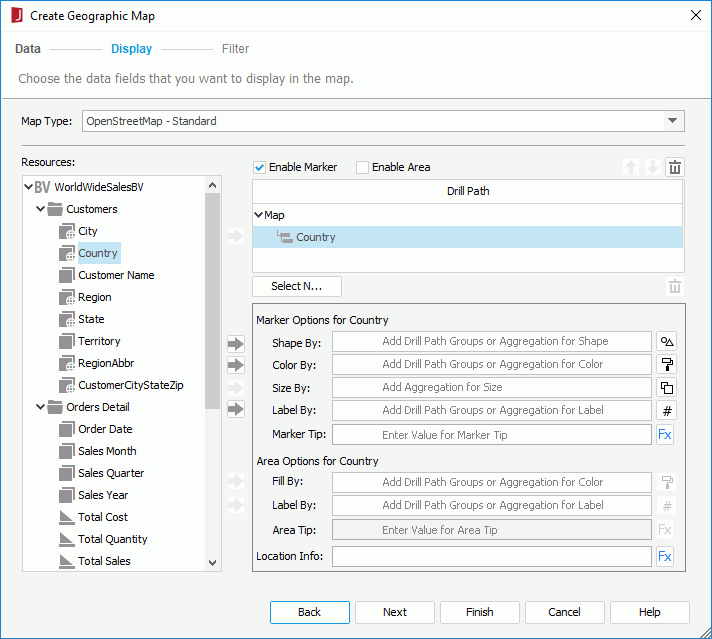
 and aggregation objects
  in the specified business view, as well as the dynamic formulas used as Group
  and dynamic formulas used as Aggregation
  for the business view in the current report. You can use them to create the geographic map.
In the Resources box, you can also further edit the business view and the objects as follows:
To add a group, select a group object or dynamic formulas used as Group in the Resources box and click  or drag and drop it to the selected node in the Drill Path box; to remove an unwanted group, select it and click
  or drag and drop it out of the Drill Path box. Make use of
  and
and  above the Drill Path box to adjust the group levels. For any group, you can specify a Select N condition for it if needed (for details about the feature, see Specifying Select N conditions for the groups).
Tip: When more than one groups are added to the Drill Path box, the go-down and go-up actions based on the geographic map will follow this hierarchical path. By default, only the values of the first group level will be shown in the Designer View mode, exported results, Web Report Studio, and JDashboard. After performing go-down action in Web Report Studio or JDashboard, it will go down to the next group level.
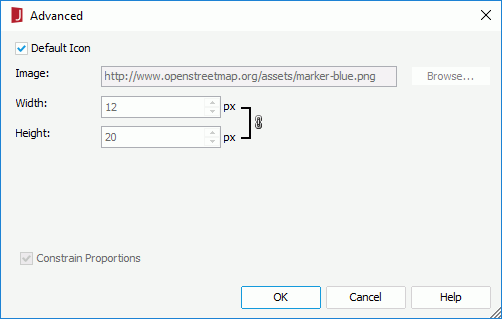
 next to the Shape By box and select a shape from the shape list, then click outside of the shape list to apply the selected shape., then check the checkbox ahead of the Advanced option in the shape list. A default image will then be applied as the shape of the markers. If you want to customize the image, after checking the checkbox, click Advanced to open the Advanced dialog to specify the image.
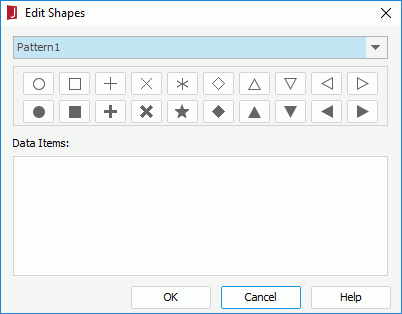
or drag and drop it to the Shape By text box, then click to open the Edit Shapes dialog to edit the shapes.
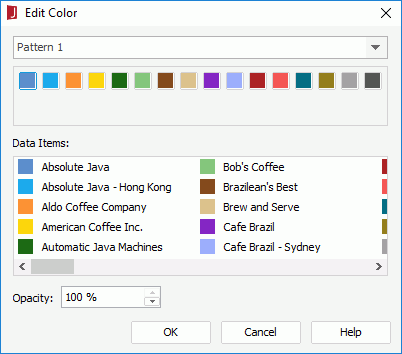
 next to the Color By text box and select a color from the color palette or click More Colors on the color palette to open the Pick a Color dialog, with which you can set a full range of color. or drag and drop it to the Shape By text box. You can add more than one group objects and when several group objects are added, you can adjust their display order by dragging and dropping them in the text box. Click to open the Edit Color dialog to edit the colors.
to add it to the Color By text box, then click to open the Edit Gradient Color dialog to edit the colors.
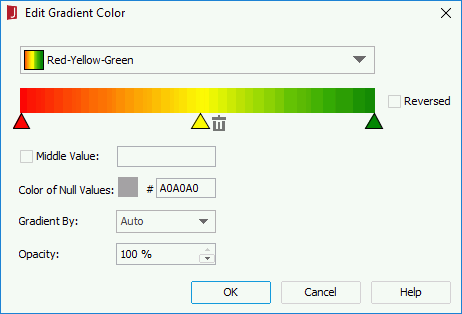
Check the Middle Value checkbox and specify the middle data value mapping to the middle color, which takes effect only when the middle color is not null. Then the gradient color will change from the start color to the middle color, and then change from the middle color to the end color. You can also set the middle value to 0 and check the Auto Expand Start/End value checkbox, in which case, the negative and positive values of the maximum absolute value will be used to map to the start color and end color, and 0 will always be in the center of the data range.
Click the color indicator button beside Color of Null Values to specify a color for null values on the color palette, or click More Colors on the color palette to access the Pick a Color dialog in which you can select a color within a wider range, or you can input the hexadecimal value of a color directly in the text box after #.
Select a gradient color algorithm between two colors from the Gradient By drop-down list, which can be Auto, RGB or HSL.
Specify the opacity of the gradient color in the Opacity text box.
Click OK to apply the specified gradient color to the markers and return to the map wizard.
or drag and drop it to the Size By text box if you want to control the size of the markers by aggregation values, then click  next to the Size By text box to specify the zoom percentage based on the default size. To restore the default size, click Reset. or by dragging and dropping them to the box. When more than one object is added, you can adjust their display order by dragging and dropping them in the text box. You can click
  next to the Label By text box to set the font properties of the labels. Then in the format box of , you can select an added object and click
  to specify its display format (for an object of number type, you can also specify whether to scale big and small numbers using the Auto Scale in Number property).
 and then select a field or use a formula to control the tip. or by dragging and dropping them to the box, then click next to the Label By text box to set the font properties of the labels. When more than one object is added, you can adjust their display order by dragging and dropping them in the text box.
and then select a field or formula from the drop-down list to control the tip. If the given formulas cannot meet your requirements, click <New Formula...> to create one.
and then select a field or formula from the drop-down list which contains the values matching the folder names in
and then select a field or use a formula to control the tip. or by dragging and dropping them to the box, then click next to the Label By text box to set the font properties of the labels. When more than one object is added, you can adjust their display order by dragging and dropping them in the text box.
and then select a field or formula from the drop-down list to control the tip. If the given formulas cannot meet your requirements, click <New Formula...> to create one.
and then select a field or formula from the drop-down list which contains the values matching the folder names in <install_root>\gisinfo\geocode. For example you may group by Country and State. For State, you would want to use a formula fStateCountry that concatenates state and country so Google Maps, OpenStreetMap or OpenCycleMap knows which state to use such as "New York, USA" or "California, USA".
JReport also supports using longitudes and latitudes as locations of the markers, however before you can do this, you need to change the value of the className option for geocoding to com.jinfonet.web.modules.map.service.DirectGeoCoder in the file config.json which is stored in <install_root>\gisinfo for both JReport Designer and JReport Server before starting them, then in JReport Designer create a formula as follows and select it from the Location Info drop-down list: @LongitudeValue + “,” + @LatitudeValue.
 that appears in the text box.
In the Web Action List dialog, bind a web action to the markers the same as you do to web controls in the library component, which will be triggered when the specified event occurs on the markers. The web actions you can bind include Parameter, Filter, Sort, Change Property and Send Message.
that appears in the text box.
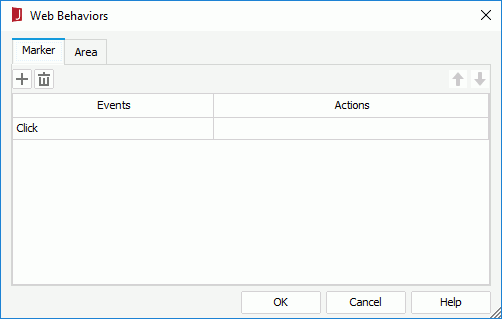
In the Web Action List dialog, bind a web action to the markers the same as you do to web controls in the library component, which will be triggered when the specified event occurs on the markers. The web actions you can bind include Parameter, Filter, Sort, Change Property and Send Message. and define them as required; if a web behavior is not required, select it and click . or to adjust the order of the behaviors, then at runtime when an event that has been bound with more than one action happens, the upper action will be triggered first.
from the Visual category of the Components panel to the destination.The Create Geographic Map wizard appears, which contains a set of screens for helping you define a geographic map easily. You can use the Back and Next buttons or click the screen name on the screen navigation bar to switch between the screens.
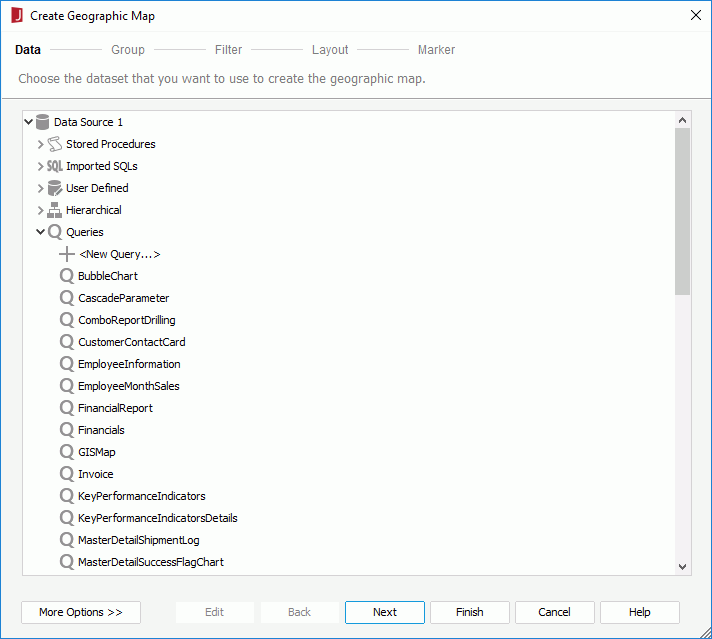
If the predefined data resources are not what you want, you can click the first item in the corresponding resource node to create one. When a query is selected, click the Edit button to modify the query if required. Then a new dataset based on the selected data resource is created in the page report.
If you want to use an existing dataset in the current page report to create the geographic map, click the More Options button and then:
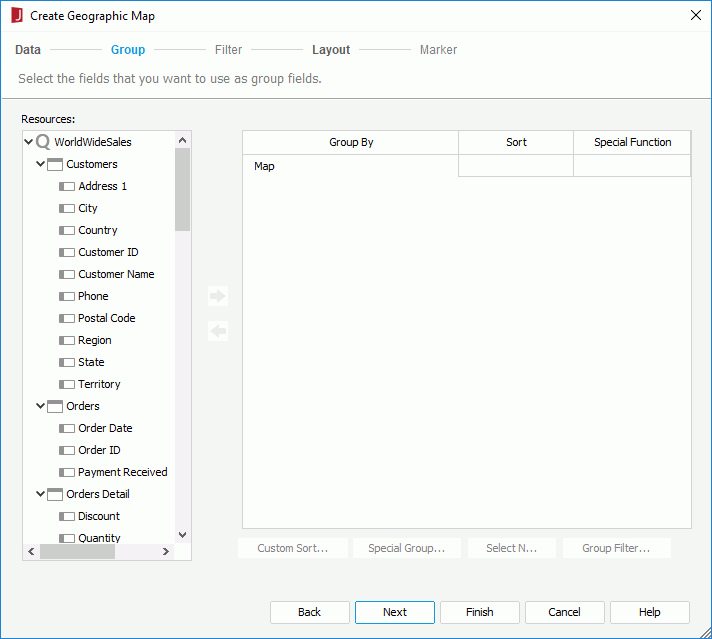
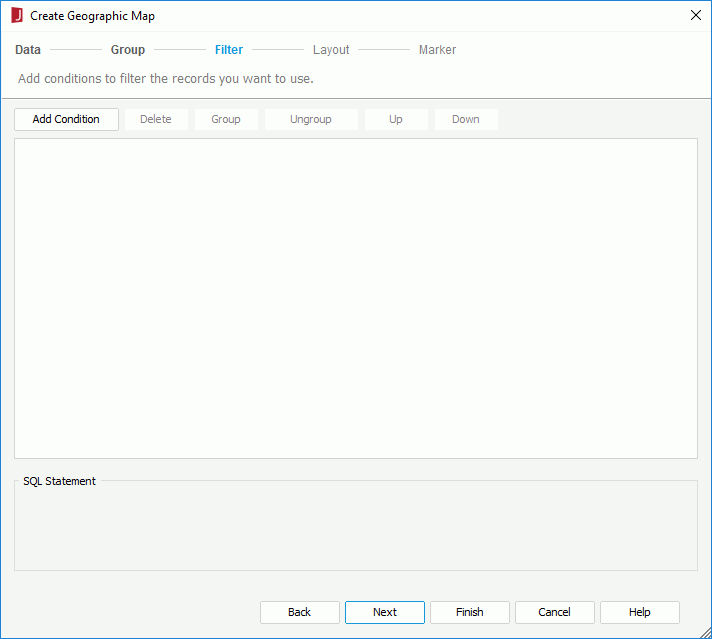
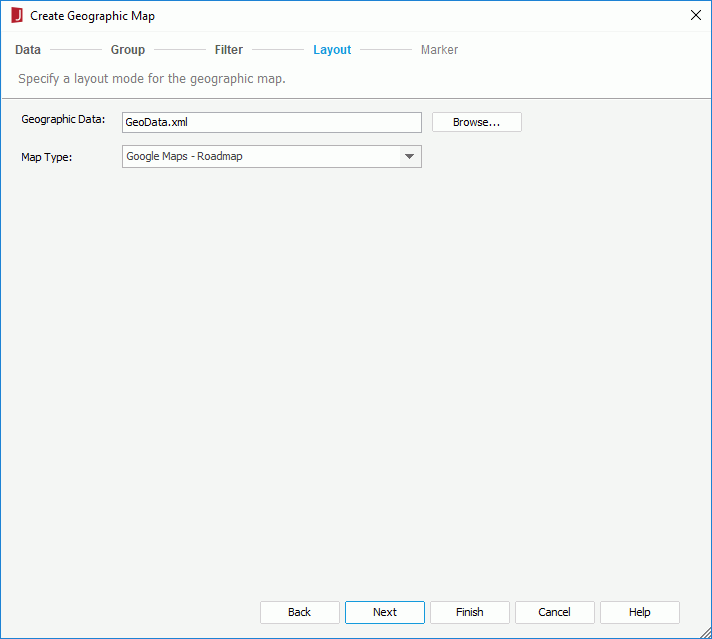
By default, GeoData.xml in the <install_root>\gisinfo directory is used for mapping the geographic latitude and longitude coordinates from Google Maps, OpenStreetMap or OpenCycleMap based on the location information specified for each group in the Marker screen. When the location information key string of a group value matches the "nm" field in the XML file, you will get the related latitude and longitude value for this group value. You can also click Browse to import an XML file which contains predefined geographic data including latitude and longitude for the specific "nm" field and the file will be copied to <install_root>\gisinfo after it is imported if it does not exist in the directory. When you publish the report from JReport Designer to JReport Server you can specify the gisinfo files you want to publish. If you do not publish the geographical information it will be created automatically when you first run the report.
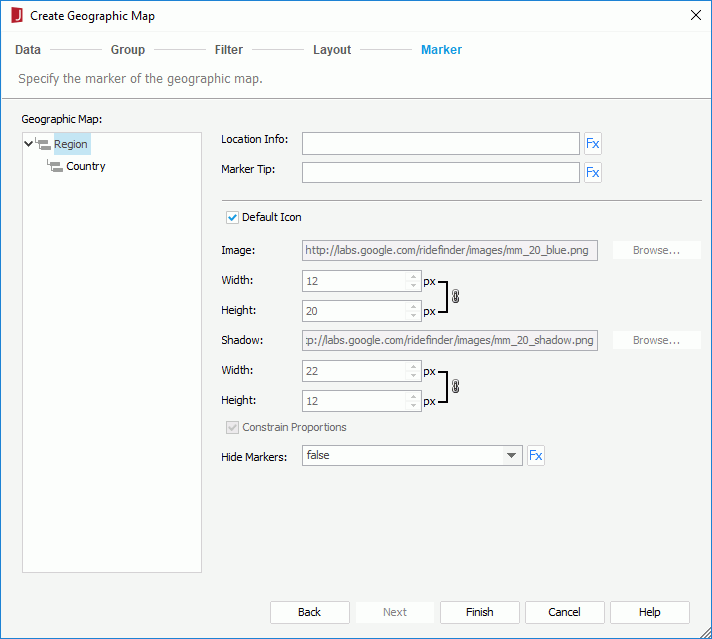
and select a field or formula from the drop-down list which contains the values matching the "nm" field in the geographic data XML file. The values seen in this Location Info field will be used to create the "nm" field values when the XML does not already exist. and then select a field or formula from the drop-down list to control the tip. to select a formula that returns a Boolean value to control this.If you have used the menu command to insert the geographic map and selected a panel in a banded object as the its destination, after finishing the wizard, you need to click the mouse button in the destination once again in order to insert the geographic map there.