 Previous Page Next Page
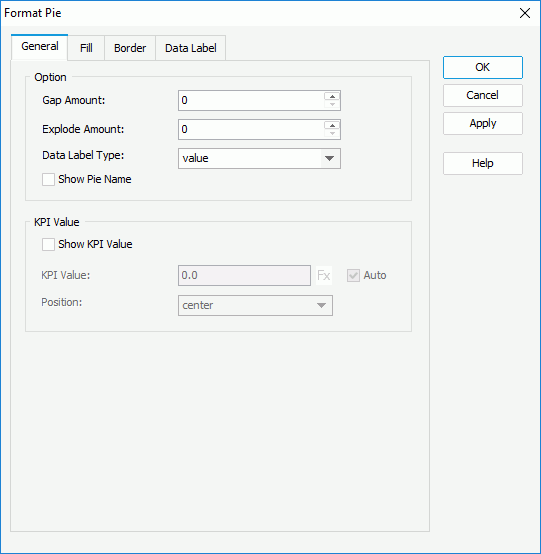
In the Gap Amount field, enter a number to set the distance between every two adjacent pies/donuts. In the Explode Amount field, enter a number to specify the distance between the sections in each pie/donut and the pie/donut center. In the Data Label Type field, specify the type of the data labels for the pie/donut sections. For a donut chart, you can also specify the radius percentage of the donut hole to the total pie circle by setting the option Donut Hole. You can display KPI value for each pie/donut by checking the Show KPI Value option and then specifying the KPI value and its position relative to the pie/donut. To use the total value of each pie/donut as the KPI value, check the Auto option, otherwise, uncheck it, and then input a value manually in the KPI value text box or click  and select a formula (or create a new one) or summary from the drop-down list. KPI values are calculated based on series if there is series, otherwise based on the total value.

If you select Use Single Color as the fill type, specify the color and the transparency of the color schema to fill the pie/donut sections in the current data series, that is the sections in the same data series as the one you have right-clicked on to open the Format Pie dialog (to change the color, click the color indicator and select a color from the color palette or input the hexadecimal value of a color directly in the text box). If required, click the Color List button to specify the color pattern for pie/donut sections in each data series respectively in the Color List dialog.
If you select Use Single Color with Condition, specify the conditions and the color pattern bound with each condition respectively. For details, refer to Adding Conditional Color Fills to Charts.
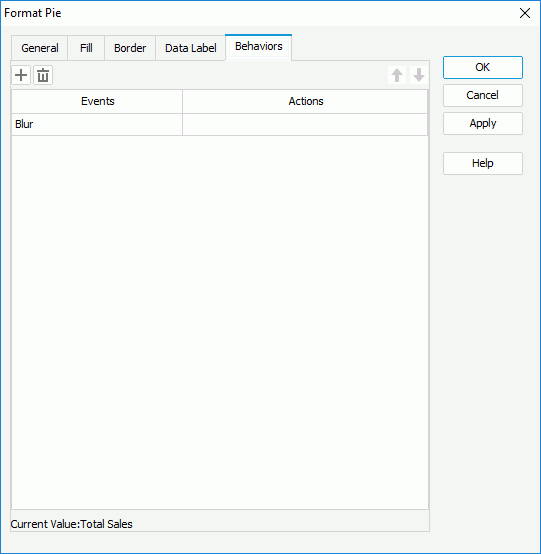
Select a trigger event from the drop-down list in the Events column, then click in the Actions column and click  that appears in the text box. In the Web Action List dialog, bind a web action to the pies/donuts the same as you do to web controls in the library component, which will be triggered when the specified event occurs on the pies/donuts. The web actions you can bind include Parameter, Filter, Sort, Change Property and Send Message.
To add more web behaviors, click  and define them as required; if a web behavior is not required, select it and click
  . Click
  or
or  to adjust the order of the behaviors, then at runtime when an event that has been bound with more than one action happens, the upper action will be triggered first.
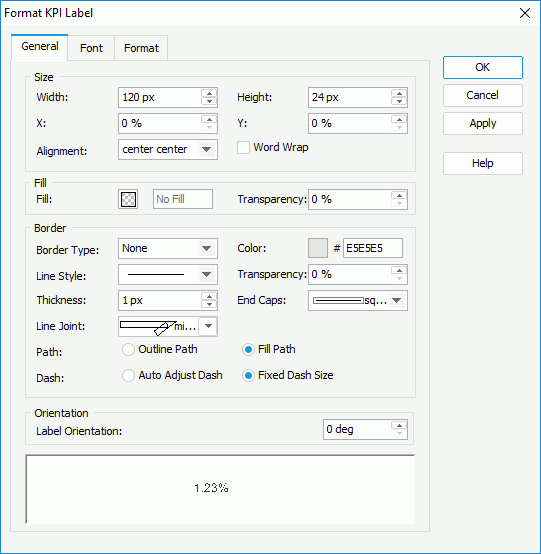
In the Size box, set the width and height of the labels, the horizontal and vertical coordinate of the top left corner of the object, relative to its parent container, the alignment of the label text, and whether to enable the word wrap function for the label text.
In the Fill box, specify the fill color and color transparency to fill the labels.
In the Border box, specify the properties for borders of the labels, including the type, color, line style, transparency, thickness, ending style, line joint style, fill pattern and dash size.
In the Orientation box, specify the angle of the labels so as to rotate them.
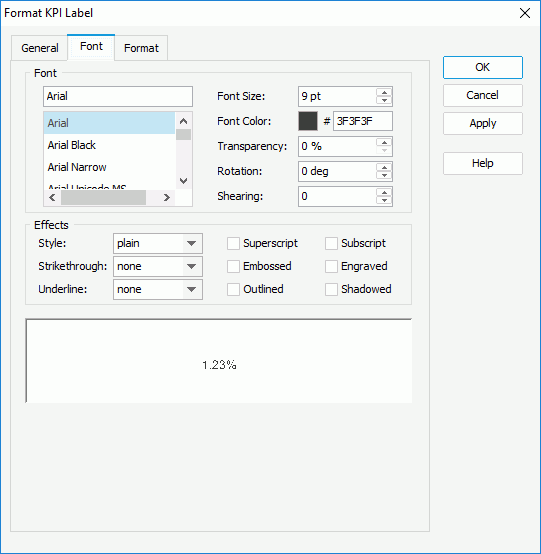
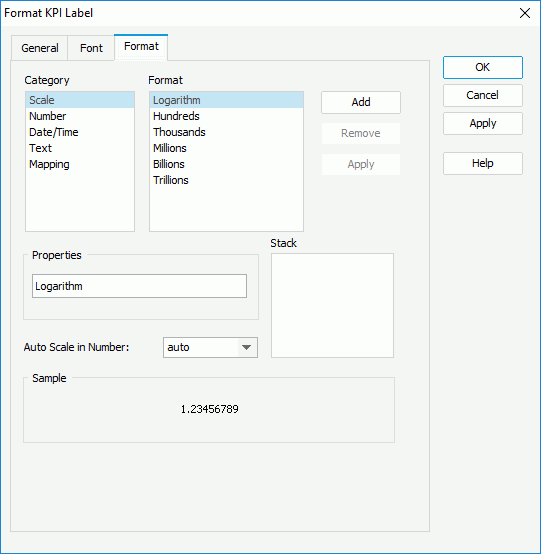
Select a category from the Category box, then select a format from the Format box and click Add to add it to the Stack box. If the formats listed in the Format box cannot meet your requirement, define the format in the Properties text box and click Add to add it as the format of the selected category. For the Number category, you can specify whether to scale big and small numbers using the Auto Scale in Number property. You can add more than one format, but for each category only one format can be added. In the event that a format is not necessary, select it in the Stack box click Remove to clear it.